European LNG Forecasting Model.
What It Does
This project forecasts European LNG (liquefied natural gas) demand at a city level using a multi-source dataset combining weather, energy usage, and financial disclosures.
It models heating degree days (HDD) to estimate heating-related demand and forecasts near-term LNG usage across European regions — useful for traders, utilities, and policy analysts.
How It's Built
-
Data Sources:
- Eurostat: country level energy consumption data
- BrightSky: city level historical + forecast weather data
- yr.no: city level historical + forecast weather data
- SEC EDGAR: LNG import/export details from company filings
-
Feature Engineering:
- Heating Degree Days per city modelled using city level weather data
- Lagged weather + usage patterns
- Cross-region trade and demand interaction features
-
Pipeline + Orchestration:
- ETL built in Python using
requests,pandas, andNumPy - Fully orchestrated in Dagster, with assets for each data source and forecast stage
- Scheduled via Dagster cron integration for weekly forecast refreshes
- ETL built in Python using
-
Modeling:
- Gradient boosting model trained on 5+ years of weather and usage data
- Outputs regional LNG demand estimates for the next 30–60 days
-
Output:
- Results are stored to local dashboards
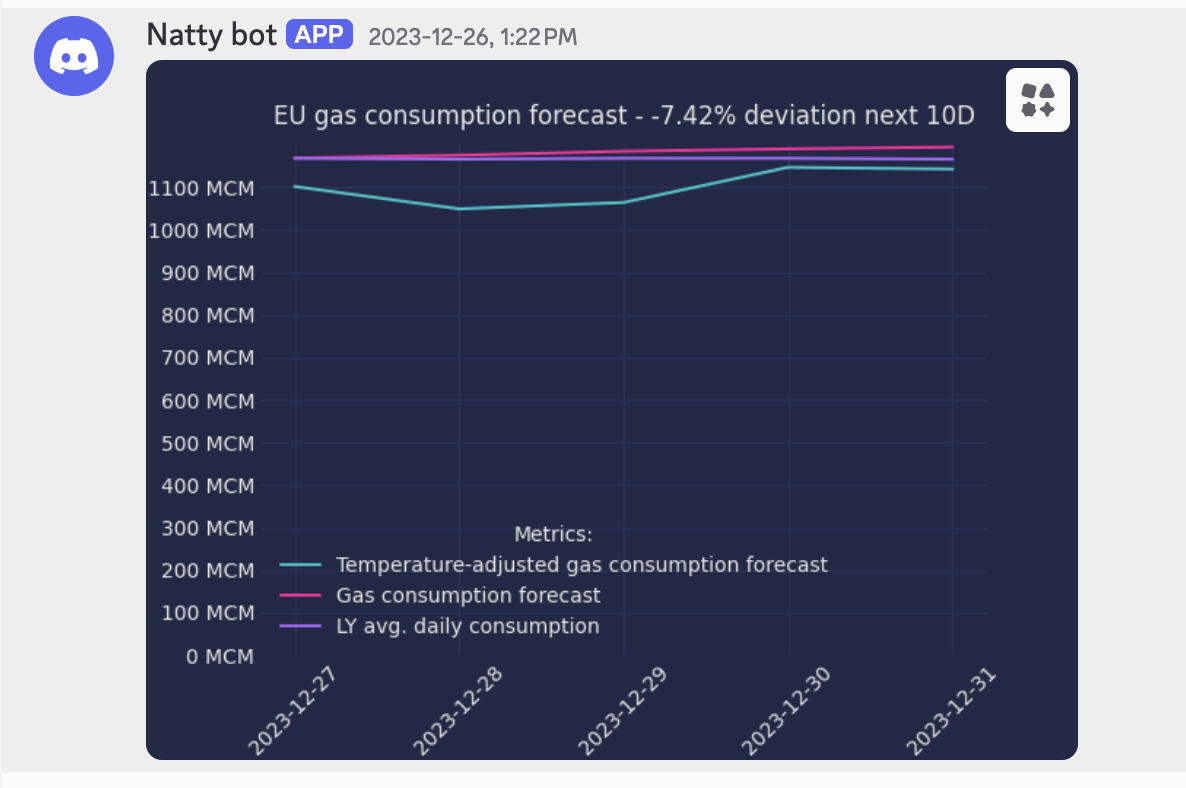
- Key forecasts optionally pushed to a Discord channel as alerts
Screenshot
Why It Matters
Europe's LNG demand is highly seasonal and sensitive to weather volatility. This tool helps:
- Anticipate regional heating demand spikes
- Adjust forecasts in response to early cold snaps or mild winters
The project is available on GitHub